Competitive Profile Matrix
Learn how Pearson’s Competitive Profile Matrix compares companies using common success factors, weights and response ratings. Explore a student CPM on Domino’s, Pizza Hut and Papa John’s, with practical improvements to factor wording, MECE, evidence and score interpretation. Student work is discussed for learning purposes only.

Beyond the Ranking: Using the Competitive Profile Matrix Better
How does a company compare with its closest competitors—and where should it improve? Pearson’s Competitive Profile Matrix (CPM) provides a structured way to answer these questions by comparing firms against common critical success factors.
The supplied student matrix compares Domino’s, Pizza Hut and Papa John’s. It offers a useful starting point for understanding CPM, while also showing why factor selection, wording and evidence matter as much as the final score.
The supplied image is student work on Domino’s, reproduced or discussed for learning purposes only. It is not an analysis conducted for this article, an official company assessment, or a verified comparison of current performance.
How Pearson’s CPM Works
Pearson explains that CPM identifies major competitors and evaluates their relative strengths and weaknesses. Its critical success factors can include both internal and external issues (Pearson Education, 2025, slide 48).
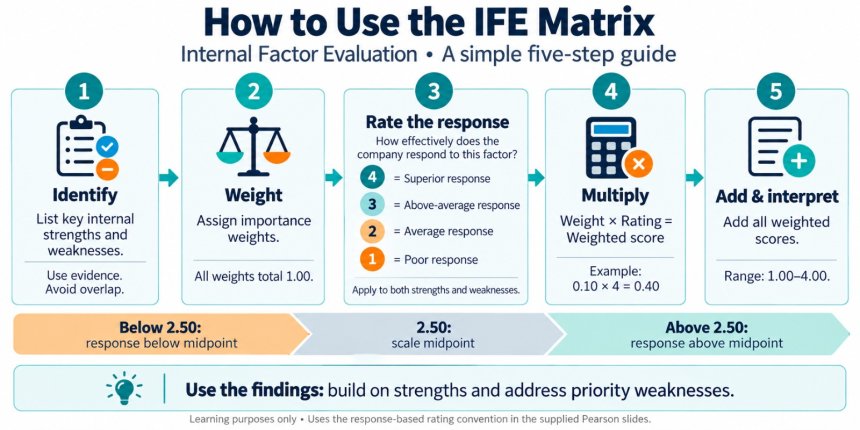
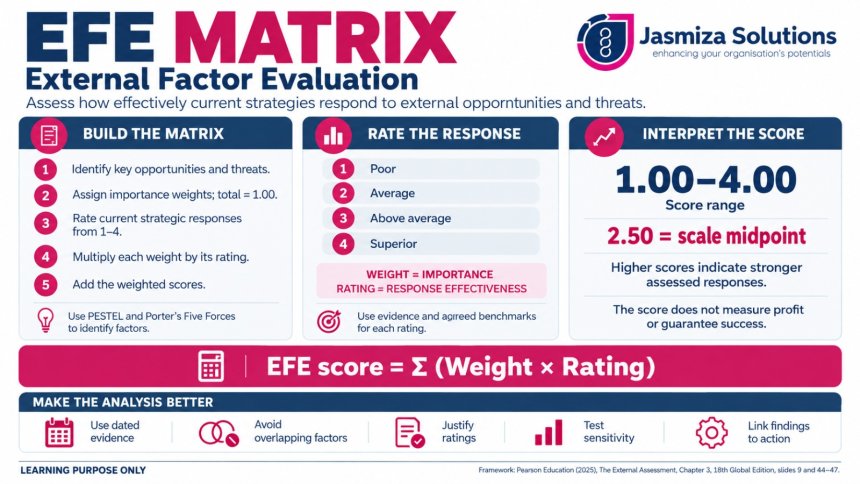
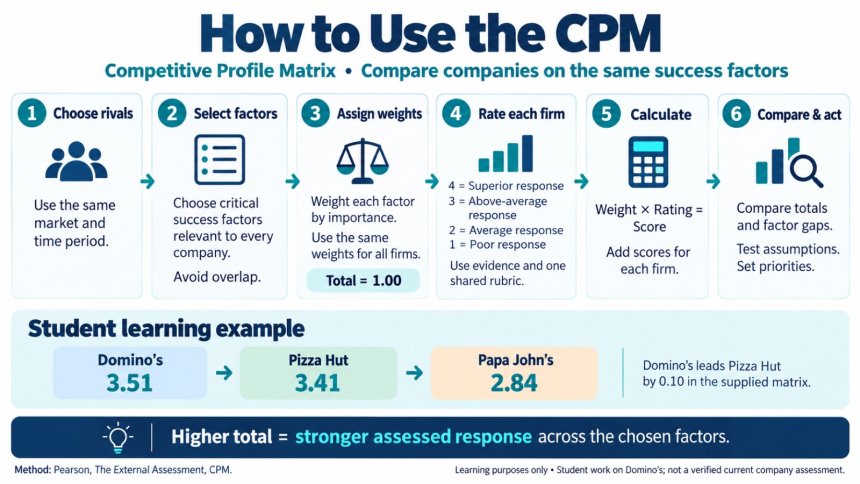
Following the response-based scale in the supplied Pearson slides, ratings indicate:
-
4: Superior response.
-
3: Above-average response.
-
2: Average response.
-
1: Poor response.
The same factors and weights apply to every company. Each company receives its own evidence-based rating, which is multiplied by the factor’s weight. The weighted scores are then added.
Weight measures importance; rating measures the effectiveness of the company’s response or performance on that factor.
A higher total indicates a stronger assessed competitive position across the selected factors. CPM is primarily a comparison between firms, so the differences between competitors are more useful than treating 2.50 as a universal pass-or-fail threshold.
What the Students’ Matrix Shows
The calculations in the supplied image are correct. The weights total 1.00, and the weighted scores produce:
| Company | Total CPM score | Position in this matrix |
|---|---|---|
| Domino’s | 3.51 | First |
| Pizza Hut | 3.41 | Second |
| Papa John’s | 2.84 | Third |
Domino’s leads Pizza Hut by 0.10 and Papa John’s by 0.67. This suggests the strongest overall assessed response among these three companies under the students’ assumptions.
However, it does not mean Domino’s is the best performer on every factor. Pizza Hut receives higher ratings for several factors, including growing digital purchasing opportunities and competition from local independent restaurants. These differences deserve attention even though Domino’s ranks first overall.
Figure 1 citation: Student-produced “Competitive Profile Matrix (CPM)” comparing Domino’s, Pizza Hut and Papa John’s; supplied by the user, authors and publication date unspecified. Learning purposes only.
Improvement 1: Use Common Success Factors, Not Company-Specific Statements
Several rows describe Domino’s circumstances rather than a neutral dimension against which every competitor can be assessed. For example, a statement about a company’s debt increasing by 45% in 2017 cannot automatically describe the financial position of its competitors.
A better CPM separates the shared factor from the evidence for each company.
| Wording in the student matrix | Clearer common success factor |
|---|---|
| Growing digital purchasing opportunities | Digital ordering effectiveness |
| Larger competitor scale | Operating scale and cost efficiency |
| Strong global brand and market position | Brand strength |
| Significant increase in long-term debt | Debt-servicing capacity |
| Flat organisational structure with unclear reporting relationships | Organisational accountability |
| Nutrition-labelling regulation, lawsuits and ingredient restrictions | Regulatory compliance capability |
Company-specific figures should sit in supporting notes, where each company can be judged using the same definitions and period.
This is an important difference from writing IFE factors. An IFE statement may name a company’s particular strength or defect. A CPM factor should usually be a neutral criterion; the company-specific evidence then explains its advantage or deficiency.
For example:
Shared factor: Digital ordering effectiveness.
Supporting assessment: Company A demonstrates stronger digital ordering performance than its peers, supported by comparable conversion, reliability and customer-retention evidence.
The assessment should only be written when the evidence supports it.
Improvement 2: Apply MECE to Reduce Double Counting
**MECE—mutually exclusive and collectively exhaustive—**helps analysts avoid repeated factors while checking that important areas have been considered.
The student matrix contains potential overlaps:
-
Growing digital purchasing opportunities and strong digital sales capability.
-
Expansion into emerging markets and expansion into high-traffic locations.
-
Rising debt and negative shareholders’ equity.
These are not necessarily duplicates, but their boundaries need explaining. Digital market growth and digital execution could be separated if they measure distinct capabilities; otherwise, both rows may reward the same advantage twice.
The matrix should also investigate potentially important gaps, such as product consistency, customer value, delivery reliability and franchisee economics. These should be added only when relevant evidence is available. The purpose is balanced coverage, not a longer list.
Pearson’s supplied CPM slide recommends an industry-tailored set of 12 factors. The students have 12, but meeting the number alone does not ensure analytical quality.
Improvement 3: Define What Each Rating Requires
A score of 4 should have an explicit evidential basis. Without a shared rubric, one reviewer might reward investment, another might reward market share, and another might reward customer satisfaction.
For digital ordering effectiveness, an illustrative rubric could be:
| Rating | Evidence required |
|---|---|
| 1 — Poor | Persistent ordering failures and performance materially below agreed benchmarks. |
| 2 — Average | Reliable basic service that broadly meets benchmarks. |
| 3 — Above average | Consistently exceeds benchmarks on agreed customer and operating measures. |
| 4 — Superior | Sustained outperformance across the key measures, supported by commercial results. |
Analysts should define the measures, thresholds and assessment period before scoring. Suitable measures might include order completion, system availability, repeat purchase and cost per order.
This rubric is a proposed learning aid, not an assessment of the three companies.
Improvement 4: Use Comparable Evidence
The matrix combines overseas expansion, U.S. digital sales, domestic supply chains and financial information from 2017. These can be relevant, but the scope must be clear.
A stronger analysis specifies whether it compares global businesses or a particular national market, and uses matching reporting periods. Each rating should have a source and a short justification.
The financial rows also need care. Increasing debt and negative equity do not, by themselves, establish a poor competitive response. Analysts should investigate their causes and consider cash generation, interest coverage and repayment capacity before assigning ratings.
Likewise, a negative-sounding factor can receive a high response rating if the company manages the issue effectively. The current mixture of weakness wording and response ratings makes that distinction difficult to follow.
Improvement 5: Test the Narrow Lead
Domino’s 0.10 lead over Pizza Hut is sensitive to scoring assumptions.
For example, the brand factor carries a weight of 0.11. If Domino’s rating on that factor fell from 4 to 3, with everything else unchanged, its total would fall from 3.51 to 3.40, slightly below Pizza Hut’s 3.41.
This does not prove the original rating is wrong. It shows that the ranking depends materially on a judgement that should be supported and tested.
A useful CPM should therefore report both the headline ranking and whether it remains stable under reasonable alternative ratings or weights.
Premises and Deduction: What Does the Score Mean?
Premise 1 — Relative strength: The students assign Domino’s a rating of 4 for brand and market position, compared with 3 for both rivals. At a weight of 0.11, Domino’s earns 0.44, giving it a 0.11 advantage over each competitor on this factor.
Premise 2 — Relative shortfall: For growing digital purchasing opportunities, Domino’s receives 3, while Pizza Hut receives 4. At a weight of 0.08, Domino’s earns 0.24, compared with Pizza Hut’s 0.32. This represents a relative disadvantage in the students’ assessment, even though a rating of 3 indicates an above-average response.
Deduction: Within this matrix, Domino’s combines important competitive advantages with areas where a rival is assessed more favourably. Its total of 3.51 suggests the strongest overall response across the selected factors, but its small lead over Pizza Hut requires cautious interpretation.
The two premises illustrate the comparison; the total depends on all 12 factors. The score is not a market-share estimate, a percentage of success, or proof of future profitability.
The strategic value of CPM lies in identifying which advantages to protect and which competitive gaps to address. A defensible ranking should emerge from clear criteria and comparable evidence—not replace them.
Reference
Pearson Education Ltd. (2025). The external assessment. Chapter 3 teaching slides accompanying Strategic Management: A Competitive Advantage Approach, Concepts and Cases, 18th Global Edition, slides 48 and 50. User-supplied PDF.
Contributor for Learning Discussion:
1. Aldanish Hazeem bin Alzulkafli aldanishhazeem@gmail.com
2. Azizullah Mohammad Ayyub azizayyub99@gmail.com
3. Norliyana Farhanah Binti Norfadelizan norliyananorfadelizan@gmail.com
4. Sarah Yasmin binti Ramlan sarahyasminramlan00@gmail.com
Share
 Like
0
Like
0
 Dislike
0
Dislike
0
 Love
0
Love
0
 Funny
0
Funny
0
 Angry
0
Angry
0
 Sad
0
Sad
0
 Wow
0
Wow
0