Beyond the Score: Using the EFE Matrix for Better Strategic Decisions
Explore Pearson’s EFE matrix, its limitations, and ways to improve strategic analysis, using Amazon and Under Armour illustrations for learning purposes only.

Beyond the Score: Using the EFE Matrix for Better Strategic Decisions
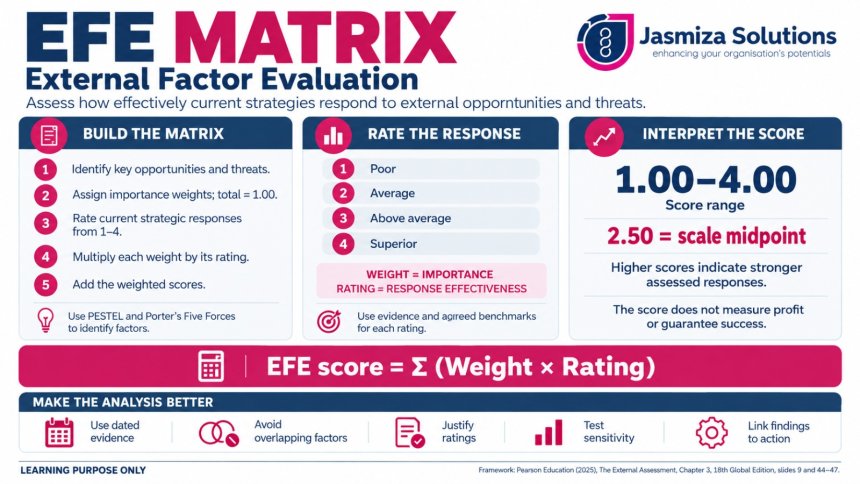
A business can operate efficiently and still struggle when its external environment changes. Shifting customer preferences, new technologies and stronger competitors can weaken a strategy that once worked well. The External Factor Evaluation (EFE) matrix helps managers organise these pressures and assess how effectively their current strategies respond.
Pearson’s chapter on external assessment presents EFE as a structured way to evaluate external opportunities and threats. Its value, however, depends on the evidence and judgement behind the numbers—not simply on producing an attractive table.
The supplied Amazon and Under Armour images are referenced here for learning purposes only. They are not presented as actual company analyses conducted for this blog, verified assessments, or evidence of either company’s current performance.
Understanding Pearson’s EFE Framework
Pearson places external assessment within the wider strategy process. PESTEL helps identify political, economic, sociocultural, technological, environmental and legal developments, while Porter’s Five Forces examines competitive pressures within an industry. These findings provide the basis for selecting important opportunities and threats (Pearson Education, 2025, slides 4–9).
The EFE process involves five steps:
-
Identify approximately 20 key external opportunities and threats.
-
Assign each factor a weight reflecting its relative importance to success in the industry. All weights together must total 1.00.
-
Rate how effectively the organisation’s current strategies respond to each factor.
-
Multiply each weight by its rating.
-
Add the weighted scores to obtain the overall EFE score.
Pearson’s response scale is 1 = poor, 2 = average, 3 = above average and 4 = superior (slide 45).
The distinction between weight and rating is essential. Weight measures importance; rating measures the effectiveness of the strategic response. A serious threat can receive a rating of 4 when the organisation responds exceptionally well. Likewise, a promising opportunity can receive a rating of 1 when the organisation fails to exploit it.
With weights totalling 1.00, the overall score ranges from 1.00 to 4.00. The midpoint of 2.50 is a useful interpretive reference, but it should not become a rigid boundary between strategic success and failure.
What the Learning Illustrations Show
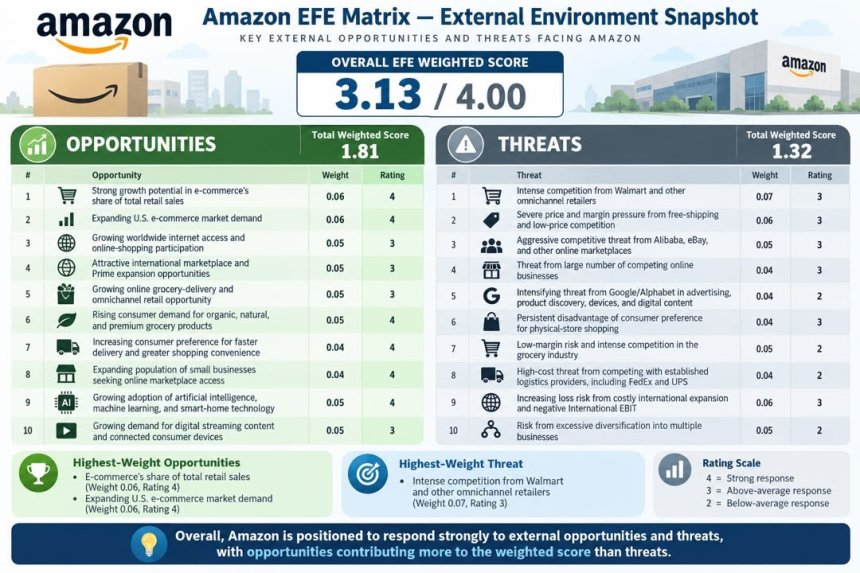
The Amazon illustration displays an overall score of 3.13, with opportunity and threat contributions of 1.81 and 1.32 respectively (Image 1). Within the illustration’s assumptions, this suggests a relatively strong strategic response.
However, the larger opportunity subtotal does not establish that opportunities outweigh threats in commercial impact. Both subtotals combine importance weights and response ratings; neither directly measures potential revenue, losses or risk exposure. The image also labels rating 2 as “below-average response,” whereas the supplied Pearson material defines it as “average response.” Consistent terminology matters.
Premise 1 — Opportunity: Growing demand in Asia-Pacific and emerging markets presents an opportunity for Under Armour. The illustration assigns this factor a response rating of 4, suggesting a superior strategic response within the example.
Premise 2 — Threat: Nike and Adidas’ greater resources and scale create competitive pressure. The illustration assigns Under Armour a response rating of 2, indicating an average response to this threat under Pearson’s scale.
Deduction from the overall score: The total EFE score of 2.48 out of 4.00, calculated across all listed opportunities and threats, suggests that Under Armour’s overall strategic response is close to, but slightly below, the 2.50 midpoint. The illustration therefore indicates an uneven response: strong in some opportunities, with room to improve its handling of competitive pressures. However, the small difference from the midpoint does not justify a firm conclusion that the strategy is ineffective. The score measures the assessed effectiveness of current responses—not profitability, the attractiveness of the environment, or the probability of success. This interpretation depends on the validity of all factors, weights and ratings; the two premises alone do not establish the total score.
Learning purpose only: this interpretation uses the supplied illustration and is not a verified assessment of Under Armour’s actual performance.
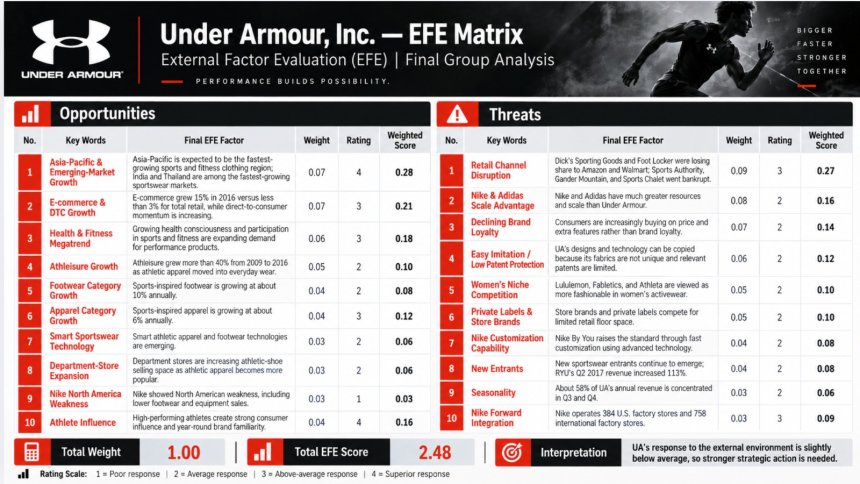
The Under Armour illustration displays 2.48, close to the scale midpoint (Image 2). Calling this slightly below the midpoint is mathematically reasonable, but the difference of 0.02 is too small to support a confident strategic judgement without examining the underlying evidence. Several factors also reference 2016 and 2017, making the assessment period particularly important.
Image 1 citation: User-supplied “Amazon EFE Matrix — External Environment Snapshot,” undated. Learning purpose only; not an actual analysis conducted for this blog.
Image 2 citation: User-supplied “Under Armour, Inc. — EFE Matrix,” undated. Learning purpose only; not an actual analysis conducted for this blog. The image’s “Final Group Analysis” wording is part of the supplied illustration.
Using the Under Armour learning illustration, the argument can be written as follows:
Premise 1 — Opportunity: Growing demand in Asia-Pacific and emerging markets presents an opportunity for Under Armour. The illustration assigns this factor a response rating of 4, suggesting a superior strategic response within the example.
Premise 2 — Threat: Nike and Adidas’ greater resources and scale create competitive pressure. The illustration assigns Under Armour a response rating of 2, indicating an average response to this threat under Pearson’s scale.
Deduction from the overall score: The total EFE score of 2.48 out of 4.00, calculated across all listed opportunities and threats, suggests that Under Armour’s overall strategic response is close to, but slightly below, the 2.50 midpoint. The illustration therefore indicates an uneven response: strong in some opportunities, with room to improve its handling of competitive pressures. However, the small difference from the midpoint does not justify a firm conclusion that the strategy is ineffective. The score measures the assessed effectiveness of current responses—not profitability, the attractiveness of the environment, or the probability of success. This interpretation depends on the validity of all factors, weights and ratings; the two premises alone do not establish the total score.
Learning purpose only: this interpretation uses the supplied illustration and is not a verified assessment of Under Armour’s actual performance.
How EFE Analysis Can Be Improved
Start with stronger factors. Pearson’s AQCD test asks whether factors are actionable, quantitative, comparative and divisional (slide 9). “E-commerce is growing” is too broad to guide a decision. A stronger factor identifies the relevant market, growth rate, period and business division, supported by a dated source. Historical classroom data should be clearly labelled.
Reduce overlap and separate external conditions from internal choices. In the Amazon illustration, several factors concern related aspects of online retail growth. Treating closely connected trends as independent factors can exaggerate their importance. “Excessive diversification” also describes a strategic choice more directly than an external development. Analysts should identify the external pressure and evaluate the company’s response separately.
Make scoring decisions transparent. Decimal weights can create an appearance of precision even when they reflect subjective judgement. Each weight needs a rationale, and each rating needs evidence of the current response. Independent scoring by several reviewers, followed by discussion of disagreements, can make assumptions easier to challenge.
A scoring rubric can improve the consistency and transparency of EFE response ratings by defining the evidence required for each score: 1 = poor response, 2 = average response, 3 = above-average response, and 4 = superior response, following Pearson’s scale. Ratings should assess how effectively the company’s current strategy addresses an external factor, supported by measurable results and relevant industry comparisons.
Illustrative EFE Scoring Rubric: Under Armour’s Response to Growing E-commerce Demand
| Rating | Response level (Pearson’s scale) | Illustrative evidence required |
|---|---|---|
| 1 | Poor response | Online sales decline while the e-commerce market grows. |
| 2 | Average response | Online sales broadly match market growth, but customer conversion and retention show limited improvement. |
| 3 | Above-average response | Online sales exceed market growth, alongside improving customer conversion and retention. |
| 4 | Superior response | Online sales consistently outperform market growth, with sustained improvements in conversion, retention and profitability. |
Application: Agree on the comparison period, relevant industry benchmarks and measurable thresholds before scoring. Rate the effectiveness of the company’s current strategic response to the opportunity.
Hypothetical example for learning purposes only. The response labels follow Pearson’s scale; the illustrative criteria are proposed for this example and do not assess Under Armour’s actual performance.
Test whether the conclusion survives reasonable changes. Sensitivity analysis can reveal whether slightly different weights or ratings materially alter the result. For example, changing a rating by one point on a factor weighted 0.07 changes the total by 0.07—more than the Under Armour illustration’s 0.02 distance from the midpoint. This makes the individual factors more informative than a simple above-or-below classification.
Connect the matrix to action and uncertainty. Each priority factor should lead to a proposed response, an accountable owner, a measurable indicator and a review date. Scenario analysis can explore different future conditions, while a separate risk review can identify severe threats that a favourable overall average might conceal. These are practical extensions to the framework, rather than additional Pearson scoring rules.
The most useful EFE matrix is one that managers can question, update and act upon. Its score should open a discussion about strategic readiness, while its supporting evidence explains where change is needed.
Reference
Pearson Education Ltd. (2025). The external assessment (Chapter 3 teaching slides). Strategic Management: A Competitive Advantage Approach, Concepts and Cases, 18th Global Edition. User-supplied PDF, particularly slides 4–9 and 44–47.
Tags:
Strategic Management, EFE Matrix, External Assessment, Business Strategy, Critical Analysis, Pearson, Learning Resources
Altruist Rising Leaders Business Acumen Reference:
|
Wk |
Course Content (Selected Topics in Business Acumen) |
PPT Slides (Rocketeer — Business Acumen for Middle Managers) |
Book Pages (Altruist: Rising Leaders in Business Acumen) |
Notes / Coverage Gaps |
|
3 |
• The External Assessment • – PESTEL, Porter’s Five Forces etc • – Customer and Supply Chain Effectiveness |
• Slide 48 • PESTEL named as a planning tool (Submodule 5) • Slides 23–27 — Submodule 3: Operating Model (Value Chain, Supply Chain) • Slides 53–58 — Submodule 6: Marketing/Customer |
• pp. 89–91 • PESTEL & SWOT named as “essential starting tools” (Element 8) • pp. 95–96 — Element 9: Supply Chain, Logistics & Blockchain — Supply Chain Effectiveness & Efficiency (exact match) • pp. 128–133 — Element 13: Customer, Consumer and Community of User |
• Supply Chain Effectiveness is an exact section-title match (book p.95). • Porter’s Five Forces is not named in either source; only PESTEL/SWOT and Porter’s Value Chain concept appear. |
Share
 Like
0
Like
0
 Dislike
0
Dislike
0
 Love
0
Love
0
 Funny
0
Funny
0
 Angry
0
Angry
0
 Sad
0
Sad
0
 Wow
0
Wow
0