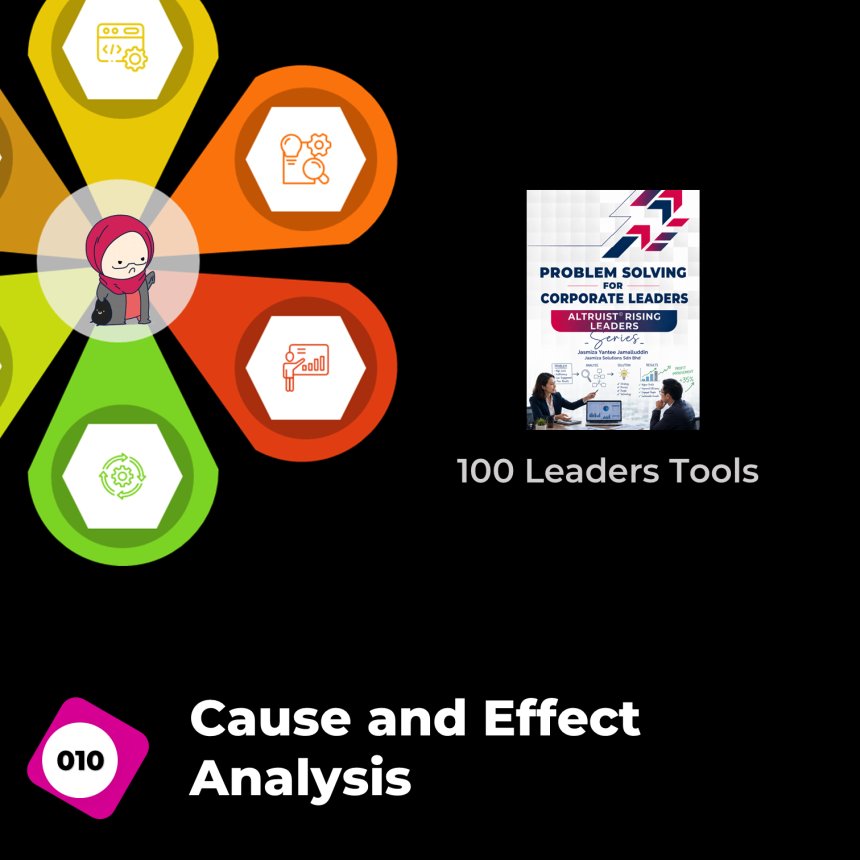
Cause and Effect Analysis (Fishbone Diagram or Ishikawa Diagram)
Cause and Effect Analysis, also known as the Fishbone Diagram or Ishikawa Diagram, is a structured Root Cause Analysis (RCA) tool used to identify, organise, and analyse the possible causes of a problem. It helps teams move beyond symptoms by systematically exploring contributing factors across categories such as People, Process, Equipment, Materials, Environment, and Management. The visual nature of the diagram encourages collaborative problem solving, promotes deeper investigation through questioning, and enables organisations to identify the true root causes that must be addressed to prevent recurrence. It is particularly effective for complex problems involving multiple interconnected causes and is widely used in quality improvement, operational excellence, safety management, and continuous improvement initiatives.

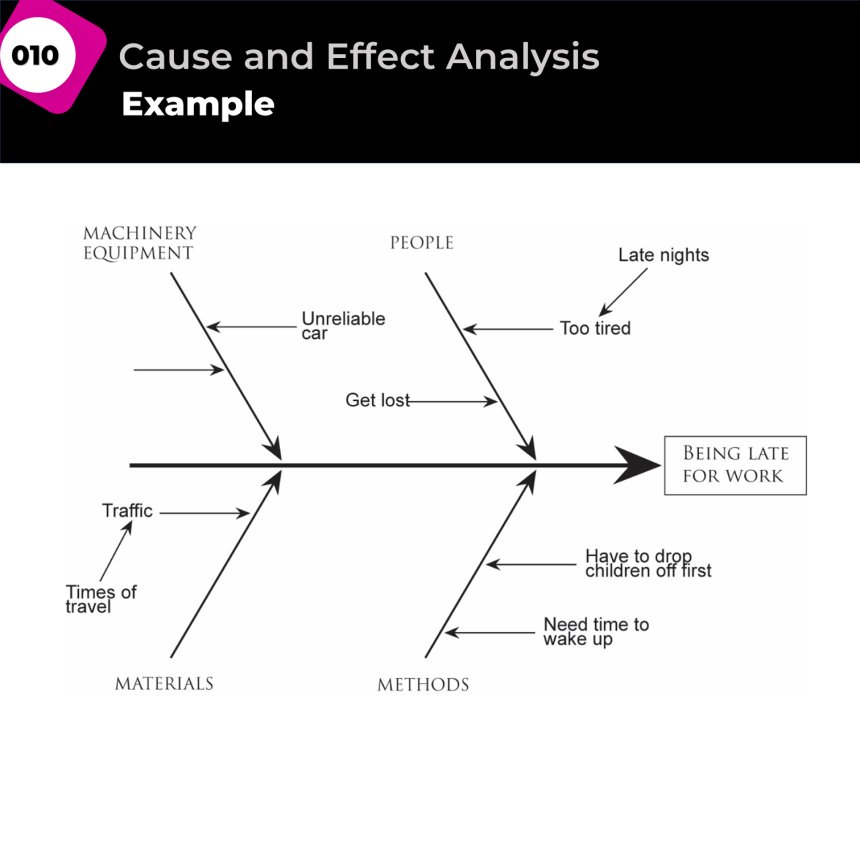
Cause and Effect Analysis, commonly known as the Fishbone or Ishikawa Diagram, is a structured Root Cause Analysis (RCA) tool used to identify, organise, and visualise the potential causes of a problem. Developed by Kaoru Ishikawa in the 1960s, the tool helps teams move beyond symptoms and systematically explore the underlying factors contributing to an issue. By categorising causes into logical groups such as People, Process, Equipment, Materials, Environment, and Management, the diagram provides a holistic view of the problem and encourages deeper investigation into cause-and-effect relationships.
The Fishbone Diagram is particularly useful when problems are complex and influenced by multiple factors. Through facilitated discussion and repeated questioning of "Why?", teams can trace contributing causes back to their root causes, reducing assumptions and improving the quality of corrective actions. The visual nature of the tool also promotes collaboration, shared understanding, and cross-functional problem solving.
Best Used When
- A problem has multiple possible causes.
- The root cause is not immediately obvious.
- Cross-functional perspectives are required.
- Teams need a structured brainstorming approach.
Key Benefits
- Separates symptoms from root causes.
- Encourages systematic and evidence-based analysis.
- Improves team collaboration and engagement.
- Creates a visual representation of complex problems.
- Supports more effective and sustainable corrective actions.
In a corporate problem-solving environment, the Fishbone Diagram is often used alongside tools such as the 5 Whys, Pareto Analysis, and FMEA to ensure that improvement efforts address the true causes of performance gaps rather than merely treating their symptoms.
Files
Share
 Like
0
Like
0
 Dislike
0
Dislike
0
 Love
0
Love
0
 Funny
0
Funny
0
 Angry
0
Angry
0
 Sad
0
Sad
0
 Wow
0
Wow
0