Beyond the Numbers: Building a Better IFE Matrix
Learn how to use Pearson’s IFE framework to assess internal strengths and weaknesses, assign weights and ratings, and interpret the overall score. Explore improvements through MECE, clearer factor statements and evidence-based scoring, with a Disney illustration for learning purposes only. Explore Pearson’s IFE matrix, interpret scores, and improve analysis with MECE, clear factor statements and a Disney example for learning purposes only.

Beyond the Numbers: Building a Better IFE Matrix
An organisation may possess valuable brands, strong market positions and growing business divisions while also facing internal weaknesses that undermine performance. The Internal Factor Evaluation (IFE) matrix helps organise these strengths and weaknesses into a structured assessment. However, a convincing assessment requires more than correct calculations: it needs clearly written factors, credible evidence and consistent judgements.
Using Pearson’s The Internal Assessment chapter and the supplied Walt Disney illustration, this article explains IFE, critiques how the analysis is constructed, and considers what its score means.
The Disney image is used for learning purposes only. It represents an illustration based on a 2018 case, not an actual analysis conducted for this article or a verified assessment of Disney’s current position.
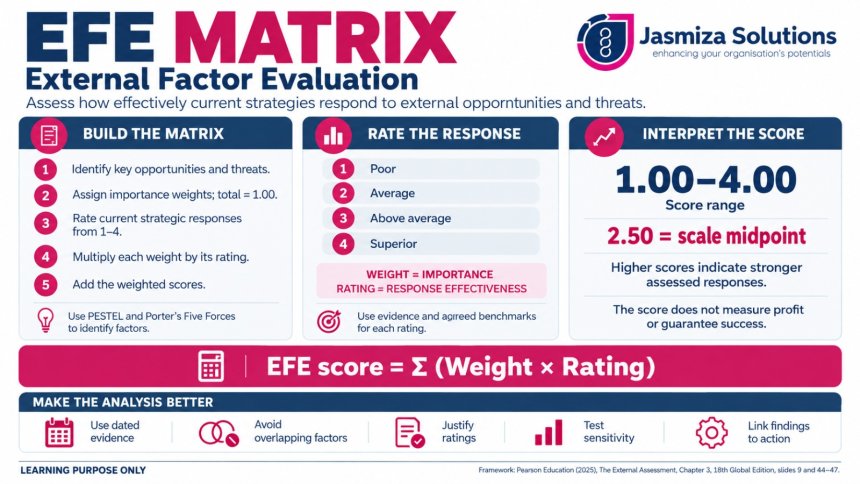
Understanding Pearson’s IFE Framework
Pearson describes internal assessment as an audit of management, marketing, finance and accounting, operations, research and development, and management information systems. The purpose is to identify the internal factors that matter most to strategic success (Pearson Education, 2025, slide 4).
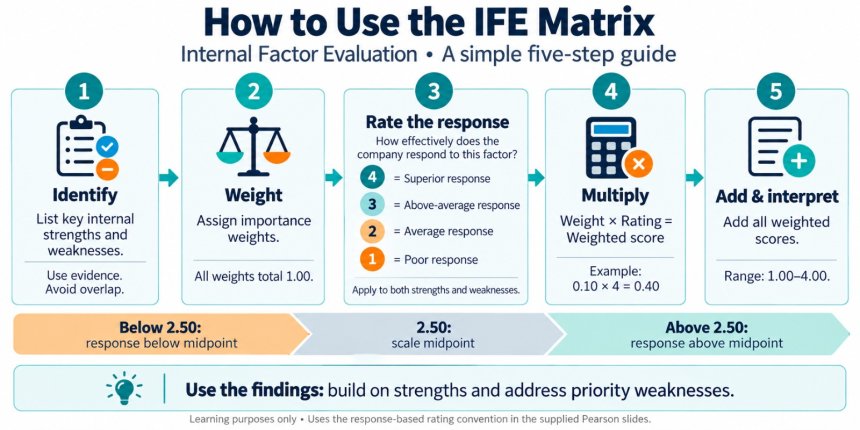
The IFE process involves:
-
Identifying key internal strengths and weaknesses.
-
Assigning importance weights that collectively total 1.00.
-
Rating each factor.
-
Multiplying each weight by its rating.
-
Adding the weighted scores.
Weight and rating answer different questions: weight asks how important a factor is to success; rating evaluates the organisation’s position on that factor.
One clarification is necessary. The supplied slides contain inconsistent rating language: slide 40 describes ratings as identifying strengths and weaknesses, while slide 42 uses response-effectiveness labels. The Disney illustration similarly describes ratings as “how well Disney has responded.”
For a consistent strengths-and-weaknesses IFE, the conventional scale is 1 = major weakness, 2 = minor weakness, 3 = minor strength, and 4 = major strength. The matrix should state its chosen convention clearly and apply it throughout.
What the Disney Illustration Shows (for discussion)

The illustration contains ten strengths and ten weaknesses. Its weights total 1.00, and the displayed weighted scores add correctly:
Strengths: 2.15 + Weaknesses: 0.55 = Total IFE score: 2.70.
This places the assessed internal position above the scale midpoint of 2.50. However, correct arithmetic does not establish that the factors, weights or ratings are well justified.
The positive weakness subtotal is also not a benefit. All ratings are positive, so weaknesses contribute smaller positive amounts to the total. The matrix does not subtract weaknesses from strengths.
Figure 1 citation: User-supplied “Walt Disney Company: IFE Matrix,” based on the Walt Disney Company 2018 case, creator and publication date unspecified. Learning purpose only; not an actual analysis conducted for this article.
Improvement 1: Apply MECE to Reduce Overlap and Gaps
MECE means mutually exclusive and collectively exhaustive. Applied to IFE, it means avoiding unnecessary duplication while covering the material areas of internal performance. It is a useful organising principle, although related business capabilities cannot always be separated perfectly.
The Disney illustration contains several potential overlaps:
-
S1 and S5: Overall parks growth may already include international parks growth.
-
S3 and S9: Media Networks’ reach and international channel distribution may partly describe the same distribution advantage.
-
W1 and W2: Declining Media Networks income and rising sports rights costs may represent an outcome and one of its causes.
-
S6 and W6: Consolidated financial results may repeat outcomes already captured by individual divisions.
These factors should not automatically be removed. Analysts should establish whether each measures a distinct capability or merely repeats evidence already counted elsewhere. For example, parks market share and parks profitability can remain separate if their strategic significance is explained.
“Collectively exhaustive” does not mean listing every fact. It means checking that important areas have been considered. The illustration emphasises financial results and market reach, but offers limited assessment of people, management, operational quality, innovation and information systems. These areas should be investigated without inventing unsupported strengths or weaknesses.
Improvement 2: Write a Subject Followed by a Clear Strength or Defect
A useful IFE factor should make a judgement explicit. A list of numbers may be informative, but the reader should not have to infer what the strength or weakness actually is.
A practical sentence structure is:
Business unit or capability + specific advantage or deficiency + supporting evidence + period or benchmark.
Using only the illustration’s claims, the wording could be improved as follows:
| Factor | Clearer analytical wording |
|---|---|
| S2: About 50% of U.S. theme park industry revenue | Disney’s U.S. theme park business has a leading revenue share, accounting for approximately 50% of the defined market compared with Universal’s 18% in the case data. |
| W1: Media Networks operating income declined | Disney’s Media Networks division shows deteriorating operating earnings, with operating income declining 11% in 2017 and a further reported 6% in Q2 2018. |
| W9: Debt, interest expense and current ratio | Disney’s short-term liquidity position has weakened, with its current ratio falling from 1.01 to 0.81 over the stated comparison period. |
The W9 rewrite isolates liquidity. Debt growth and interest costs should be evaluated separately if they represent another material issue.
Words such as “strong,” “weak” and “superior” require evidence. Likewise, a decline identifies a performance problem but does not, by itself, establish its cause. Analysts should avoid claiming poor management or cost control without supporting information.
Improvement 3: Use Pearson’s AQCD Test
Pearson recommends factors that are actionable, quantitative, comparative and divisional, wherever possible (slide 41).
The illustration includes many numbers, but numbers alone do not satisfy all four criteria. A factor becomes more useful when it identifies a particular division, compares performance over a defined period or against a relevant benchmark, and helps managers identify a decision.
For example, Media Networks’ share of total revenue demonstrates its size within Disney. It does not automatically establish competitive strength. Analysts would need evidence explaining why that scale provides an advantage.
Improvement 4: Improve Evidence and Comparability
Several illustrated factors need additional scrutiny:
-
Different time periods: S6 reports quarterly growth while W6 reports declines without specifying a period. Both may be accurate, but readers need the dates and comparison bases.
-
Ambiguous financial signals: High earnings per share or a high price-to-earnings ratio does not automatically demonstrate superior internal capability. Raw EPS comparisons across companies can be misleading.
-
Unproven weaknesses: A large goodwill balance requires investigation; its size alone does not establish that acquisitions performed poorly.
-
Comparison quality: Disney’s and Comcast’s gross margins require consistent definitions, periods and consideration of business mix.
-
Internal versus external factors: Rising industry sports rights prices are an external pressure. An IFE weakness should identify Disney’s internal exposure, contractual commitments or inability to monetise those costs, supported by evidence.
Every factor should therefore include a source, reporting period and short explanation of its classification.
Improvement 5: Make Ratings and Weights Reviewable
A rating rubric can distinguish a major strength from a minor strength using evidence of relative performance, durability and strategic significance. Weakness ratings should similarly reflect the severity and persistence of the deficiency.
Weights also need explanations. Why does parks growth receive 0.10, while the intellectual property portfolio receives 0.03? These choices may be defensible, but the matrix does not show the reasoning.
Reviewers should score independently, discuss disagreements and test alternative assumptions. A one-point rating change on a factor weighted 0.10 changes the total by 0.10. Several reasonable revisions could therefore materially affect the interpretation of 2.70.
From Strength and Weakness to Strategic Meaning
Premise 1 — Strength: Within the learning illustration, Disney’s parks business demonstrates strong operating performance, with revenue increasing 8.5% to $18.4 billion and operating income increasing 14.4%. Its weight of 0.10 and rating of 4 identify it as a highly important major strength, contributing 0.40 to the total.
Premise 2 — Weakness: Disney’s Media Networks division shows declining operating income. Its weight of 0.08 and rating of 1 identify it as a significant major weakness, contributing 0.08.
Deduction: Together, these premises suggest uneven internal performance: a strong parks business coexists with weakness in Media Networks. A reasonable strategic implication is to protect the parks advantage while investigating and addressing the causes of declining media earnings.
Across all listed factors, the total score of 2.70 suggests an internal position moderately above the 2.50 midpoint, conditional on the matrix’s assumptions. It does not mean Disney is “70% strong,” that every division performs well, or that future success is assured. The two premises illustrate the argument; they do not independently establish the overall score.
A better IFE matrix makes the path from evidence to judgement visible. Clear factor wording, careful treatment of overlap, consistent ratings and explicit strategic implications turn a numerical summary into a more useful basis for decisions.
Reference
Pearson Education Ltd. (2025). The internal assessment. Chapter 4 teaching slides accompanying Strategic Management: A Competitive Advantage Approach, Concepts and Cases, 18th Global Edition. User-supplied PDF, particularly slides 4, 29 and 40–44.
Contribution by Group 3 GSM MBA Discussion Sem 1 Business Strategy 2026
Group 3
1. Hajjara Alua Korah korahajjaralua@gmail.com
2. Riya Zainab riyazainab15@gmail.com
3. Zahira Sofiya binti zahisham zzahirasofiya@gmail.com
4. Farrel Muhammad Ramadhan farrelisnaini@gmail.com
Share
 Like
0
Like
0
 Dislike
0
Dislike
0
 Love
0
Love
0
 Funny
0
Funny
0
 Angry
0
Angry
0
 Sad
0
Sad
0
 Wow
0
Wow
0